
Brent Just Had Its Worst Month Since Covid. The Deal Is Not Signed.
Oil dropped 19 percent in May 2026 on ceasefire optimism, but the Strait of Hormuz remains closed, the MOU awaits Trump's signature, and Iranian forces fired missiles at Kuwait on Thursday. Southeast Asian traders are sitting inside the most asymmetric energy market setup of the year.
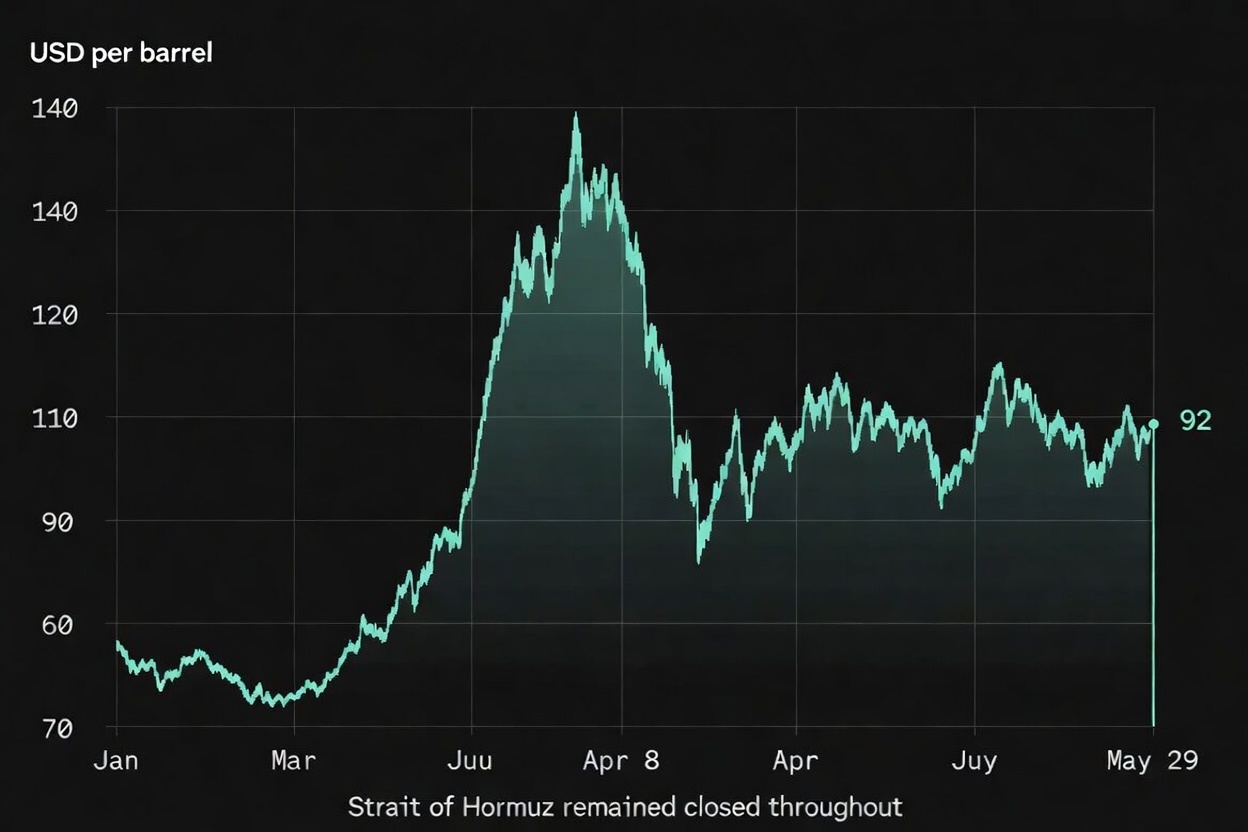
On Friday May 29, 2026, Brent crude closed at $92.23 per barrel, down more than 1 percent on the day and down approximately 19 percent for the month. It was Brent's worst monthly performance since the Covid-19 pandemic. WTI fell 9.3 percent in the final week alone, the biggest single-week loss since the week ending April 13. The catalyst was not a resolution. It was the news that negotiators had drafted a 60-day Memorandum of Understanding to extend the ceasefire and open talks on Iran's nuclear program. The MOU still awaited the signature of President Donald Trump as of Friday morning. The Strait of Hormuz remained physically closed. Iranian forces fired ballistic missiles at Kuwait and sent attack drones toward the Strait on Thursday, the same day the MOU was being finalized. Not a single additional barrel of oil had reached the market. The price fell 19 percent on the prospect of a deal that had not yet been signed, in a waterway that had not yet reopened.
The Gap Between Diplomacy and Physical Reality
UBS analysts described the situation precisely in a note published this week. There is, they wrote, still little evidence of any short-term improvement in vessel traffic or energy flows through the region. Iran crude loadings for May remained below 0.3 million barrels per day, down sharply from April's average of 1.5 million barrels per day and March's 1.7 million barrels per day. Crude loadings inside the Gulf remain extremely low. The infrastructure damage to the Ras Laffan LNG complex in Qatar, which accounts for approximately 20 percent of global LNG production, has not been repaired. Bob Parker of the International Capital Markets Association noted that oil prices are likely to remain between $90 and $100 even in a best-case scenario, because the physical capacity to restore supply is constrained by infrastructure damage that takes months to address regardless of diplomatic progress.
This gap between the diplomatic signal and the physical supply reality is the defining analytical challenge of the May 2026 oil market, and it is the challenge that creates the most commercially significant positioning decisions for retail commodity traders across Southeast Asia right now. The market has priced optimism. It has not priced resolution. The MOU is a 60-day framework that still requires Trump's signature, that still leaves the Strait physically closed during a de-mining period of up to 30 days after signing, and that still depends on Iranian compliance with terms that were being violated in the form of missile strikes even as the document was being drafted.
For traders managing oil CFD positions over the coming weekend and into the first week of June, this is not ambiguity for its own sake. It is a structured set of scenarios with specific directional implications. Trump signs and markets extend the rally. Trump delays or adds conditions and markets partially reverse the May sell-off. The ceasefire framework holds but de-mining takes longer than 30 days and supply recovery is pushed into August, keeping prices structurally elevated. Iranian military activity continues despite the MOU and the deal collapses within weeks, driving a sharp reversal of the entire May price compression. Each scenario is analytically tractable. None is certain.
What the May Sell-Off Did to the Southeast Asian Energy Import Calculation
For the energy-importing economies of Southeast Asia, Brent at $92 represents a partial but meaningful reduction of the import cost burden that has been suppressing consumer spending power, corporate margins, and central bank policy flexibility since March. The Philippines, which declared a national energy emergency in March, Thailand, which has been running current account pressure from elevated fuel import costs, Vietnam, which faced oil reserves below 20 days at the peak of the supply disruption, and Indonesia, which imports a significant share of its refined petroleum needs despite being a commodity producer, all face structurally easier conditions at $92 than at $106 or $141.
The ASEAN currency implications are visible in the trading data. The Malaysian ringgit, which had been the regional currency outperformer on the back of its semiconductor supply chain positioning, held its gains through May as oil declined, because the ringgit's partial natural hedge from LNG exports means that oil price compression is less unambiguously positive for Malaysia than for pure energy importers like Thailand and the Philippines. The Thai baht and Indonesian rupiah, by contrast, have found some support from the reduced energy import cost burden at lower oil prices. The directional logic is not complicated: lower oil reduces inflation pressure, reduces current account drain, reduces the urgency of rate hikes to defend the currency, and creates space for the central banks of energy-importing ASEAN economies to be more accommodative.
The practical complication is that none of this relief is locked in. It is priced on diplomacy that as of Friday morning had not produced a signed document. The Bank of Thailand, Bank Indonesia, and Bangko Sentral ng Pilipinas are all making rate path assessments this month against an oil price that reflects a ceasefire MOU that has not been executed. If Trump does not sign, or if the MOU collapses in the first weeks of implementation, the oil price retraces and the central bank calculus reverts. The ASEAN currency relief that traders have been pricing since the MOU news broke on Thursday is conditional relief, and the condition has not been met.
Gold's Behaviour Reveals What the Market Actually Believes
Gold's price action through May 2026 is the most analytically informative single indicator of what sophisticated market participants actually believe about the Iran ceasefire story, as distinct from what the oil price movement might suggest. Gold has not collapsed alongside oil. It has held. Gold closed above $4,600 per ounce on Friday, well below its January 2026 record of $5,595 but still historically elevated and still supported by the institutional demand dynamics, central bank purchasing and fiscal deficit concerns, that are independent of any single geopolitical event.
If markets genuinely believed the ceasefire MOU represented a durable resolution of the Middle East energy crisis, gold would be falling sharply alongside oil. The logic is direct: ceasefire reduces inflation expectations, reduces safe-haven demand, reduces the case for gold as an inflation hedge and as a crisis alternative to dollar assets. Instead, gold is holding. The market is telling you, through gold's price, that it views the MOU as a stage in an ongoing process rather than a resolution, and that the geopolitical risk premium it has assigned to precious metals over the past three months has not been fully withdrawn simply because two sets of negotiators drafted a 60-day framework document.
The market priced the ceasefire. It did not price the resolution. That gap is not noise. It is the trade.
The Scenario Map That Matters for the Week Ahead
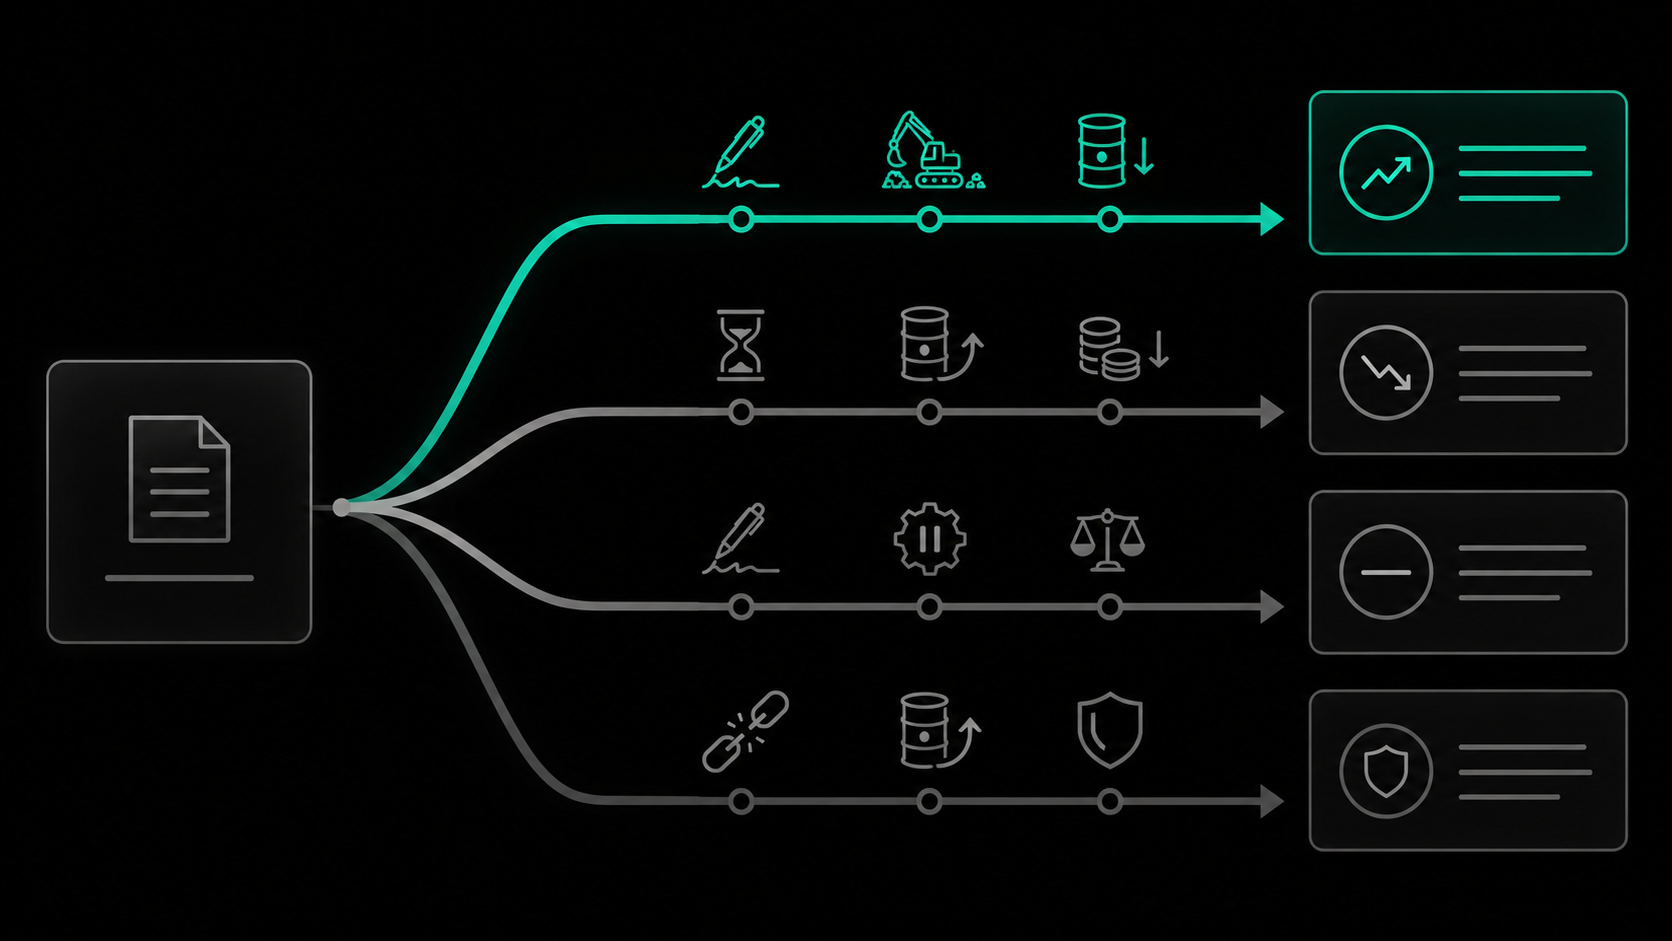
The first week of June 2026 is the most directionally significant week for energy markets since the original April 8 ceasefire announcement. Trump's decision on the MOU will arrive, one way or another, in a window that will define whether May's 19 percent oil decline extends, stabilises, or reverses. The four scenarios are not equally likely, but they are all analytically live, and each produces a distinct set of second-order implications for Southeast Asian forex, commodity CFD, and equity index traders.
- Trump signs the MOU and de-mining begins: oil extends its decline toward the $85 to $90 range, ASEAN energy-importer currencies gain modestly, gold dips on reduced inflation fear but holds above $4,400 on residual geopolitical risk, regional equity markets rally on lower energy cost expectations.
- Trump delays or conditions the MOU: oil partially retraces toward $97 to $100, ASEAN currencies give back some of the May gains, gold holds or rises slightly as uncertainty premium is restored, the market re-enters a waiting pattern similar to the April 22 extension episode.
- MOU signed but implementation stalls beyond 30 days on de-mining logistics: oil stabilises between $90 and $95 for an extended period, prices reflect a market that is no longer in crisis mode but has not fully removed the supply disruption premium, ASEAN central banks gain moderate policy space without full normalisation.
- MOU collapses within weeks due to continued Iranian military activity or diplomatic failure: sharp oil reversal toward $110 or above, ASEAN currencies face renewed pressure, gold surges as the safe-haven bid is fully restored, regional equity markets sell off on the return of energy cost and inflation expectations.
The asymmetry in these scenarios matters for position sizing. The downside scenario, MOU collapse and oil back toward $110, represents a larger absolute price move than the upside scenario, oil extending toward $85. Markets that have already priced significant optimism carry a larger reversal risk than a flat base case would suggest. Traders who are positioned for continued oil weakness going into the first week of June are implicitly accepting that risk. Traders who understand the specific structure of what is and is not yet resolved, the MOU is drafted but unsigned, the Strait is closed, infrastructure is damaged, Iranian military activity continued on Thursday, are making a more informed assessment of that risk than those who are simply following the month-end price trend.
The Financial Brand Opportunity in a Market Defined by Structured Uncertainty
The May 2026 oil market has produced what is arguably the richest analytical environment for retail commodity traders in Southeast Asia in several years. The price signal, down 19 percent in a month on a deal that has not been signed, is itself the story. Understanding why the market moved, what conditions were actually met and not met, what the four scenario branches imply for the specific asset classes Southeast Asian traders are most active in, and how to size positions against binary diplomatic outcomes that can resolve in either direction over a weekend, is the analytical content that the increasingly professional retail trading audience in the region is actively seeking from the financial brands they have chosen to trust.
The brands that are producing this level of analytical clarity, in Thai, Vietnamese, Bahasa Indonesia, and Bahasa Malaysia, in the last days of May and the first days of June, are building the kind of demonstrated market expertise that converts content consumption into commercial client relationships. The brands that are producing generic market wraps noting that oil fell this week are producing content that the audience has already seen from a dozen sources, none of which required any regional expertise to generate. The gap between these two approaches is not a content quality gap. It is a trust architecture gap. And in a market that is currently pricing a ceasefire that has not yet been signed, that gap has never been more commercially consequential.